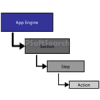
 Application Engines are PeopleSoft’s way of tying SQL and PeopleCode into a powerful processing engine that can run synchronously as well as in batch mode. App Engines are well-structured and easy to debug. In this post will see how TRACE an App Engine program. We will see how to debug an App Engine separately.
As tracing brings significant overhead, by default, tracing is turned off. You will have to enable it using one of the methods below depending on the specific scenario. Simultaneously using more than one of these may produce misleading results.
Process Scheduler
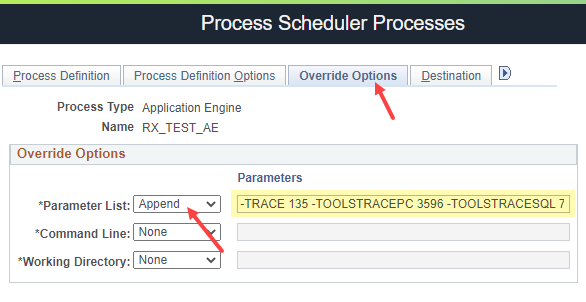
One of the most common ways of tracing an App Engine is by setting the TRACE at the Process Scheduler. To do this, we need to open the process definition for the App engine in question and navigate to the Override Options tab. Select ‘Append’ in the Parameter List drop-down and fill in the Parameters field with the below command.

-TRACE 135 -TOOLSTRACEPC 3596 -TOOLSTRACESQL 7
This tool can help you analyze your trace files: PeopleSoft Trace Magic
Based on your requirement, you can use the below values for tracing. To specify a combination of traces, use the sum of the corresponding trace values. Say, to enable the first four options all at once, you would use the sum of 1, 2, 4 and 128 ie; 135
| Value | Description |
|---|---|
| 0 | Disables tracing. |
| 1 | Initiates the Application Engine step trace. |
| 2 | Initiates the Application Engine SQL trace. |
| 4 | Initiates the trace for dedicated temporary table allocation to an Application Engine trace (AET) file. You can trace how the system allocates, locks, and releases temporary tables during program runs. |
| 128 | Initiates the statement timings trace to a file, which is similar to the COBOL timings trace to a file. |
| 256 | Initiates the PeopleCode detail to the file for the timings trace. |
| 1024 | Initiates the statement timings trace, but stores the results in the following tables: PS_BAT_TIMINGS_LOG and PS_BAT_TIMINGS_DTL. |
| 2048 | Requests a database optimizer trace file. |
| 4096 | Requests a database optimizer to be inserted in the Explain Plan table of the current database. |
| 8192 | Sets a trace for PeopleSoft Integration Broker transform programs. |
Configuration Manager
To enable tracing for an App Engine running on a Windows PC ie; two-tier mode, we use the Configuration Manager. Launch the Configuration Manager and select the needed level of tracing from the Trace tab.
Command Line
To enable Tracing for an App Engine executed from the command line, use the -TRACE option similar to the one used in the process definition. An example as shown in PeopleBooks is
n:\pt840\bin\client\winx86\psae.exe -CT MICROSFT -CD PT800GES -CO PTDMO? -CP PTDMO -R PT8GES -AI AETESTPROG -I 45 -TRACE 2
Server Configuration Files
For programs invoked by PeopleCode and run on the application server, set the TraceAE parameter in the Trace section of the Application Server configuration file (PSAPPSRV.CFG). You can use PSADMIN to set this parameter.


